
Data Visualization Gallery
Excel-generated barplots are boring. In this page I will keep sharing the codes for eye-catching plots that I made during several projects, which I think are interesting and might be useful in specific situations, mostly in bioinformatics and computational biomedicine research. Hope they give you ideas for your projects.
-
Visualizing the association between categories or the dynamics of variables over time using alluvial plot
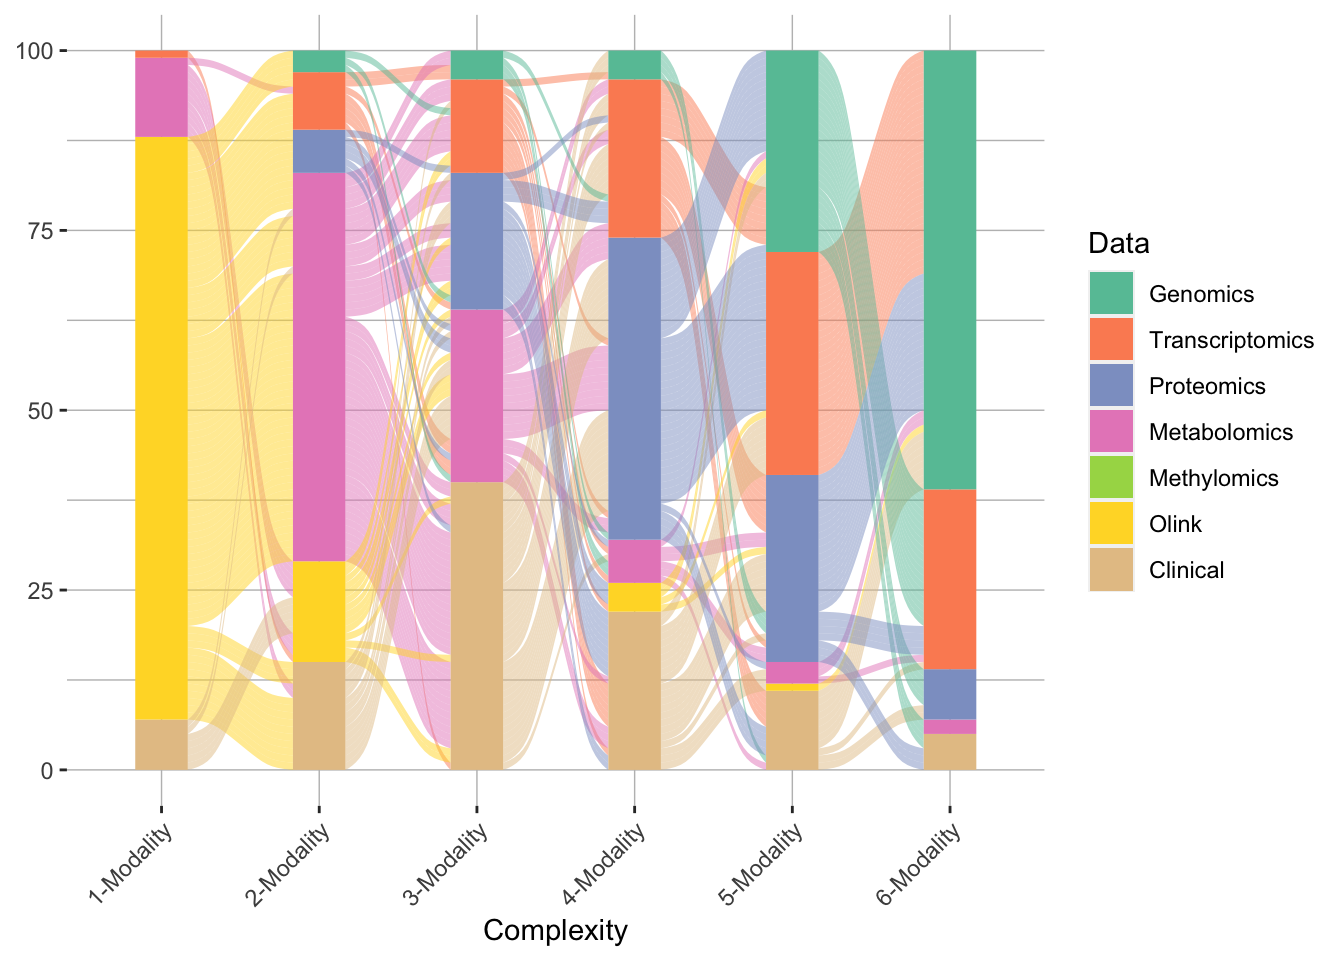
Alluvial plot is versatile and useful in many situations. It can be used to describe the associations between the categories of two or three factor variables. In many cases alluvial plot can also visualize the flow or changes of one or more variables over time or different conditions. In this post I will demeonstrate the utility of alluvial plot in the latter case. Specifically, I will visualize the changes in data modality that a model uses across several training iterations, in the case of IMML model training.
-
Visualize the association between two continuous variables over time using lineplot
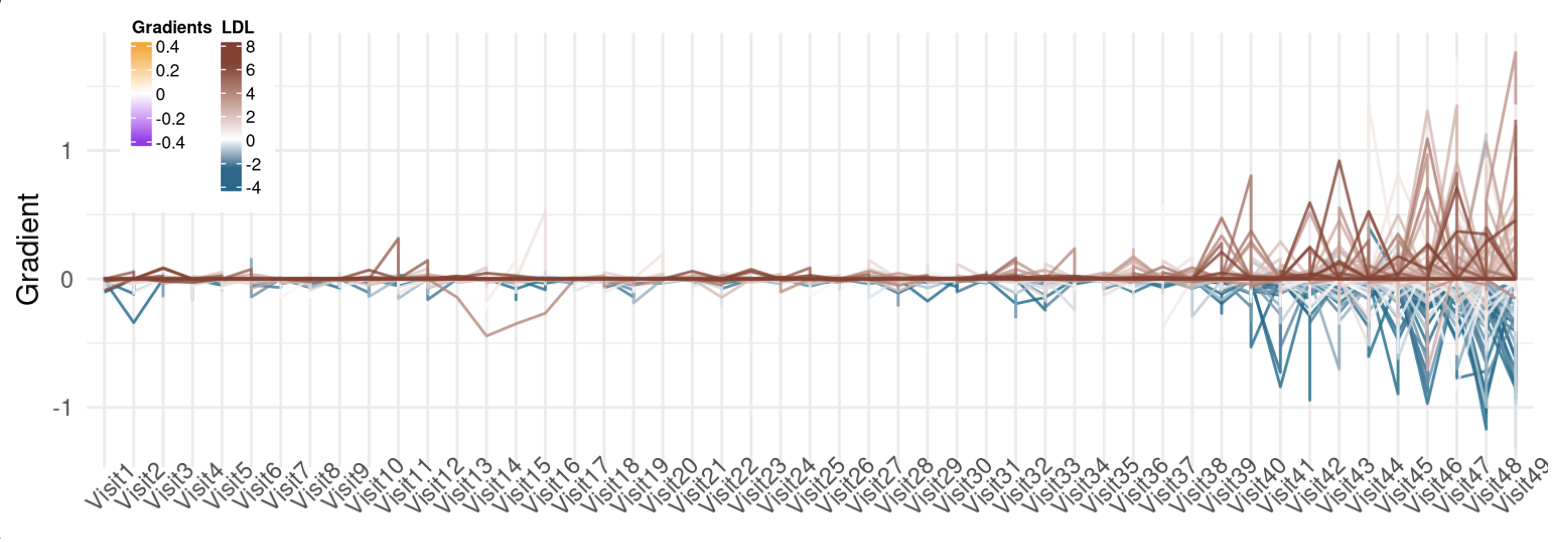
This line plot is useful when you have two continuos variables that are correlated to each other the association is a function of time. Particularly, I used this plot to visualize the dynamics in the association between the integrated gradient of a biomarker (TSH) to the target variable (LDL) accross several doctor visits in the DPV project.
-
Describing set combinations with boxplot, tileplot and UpSet plot
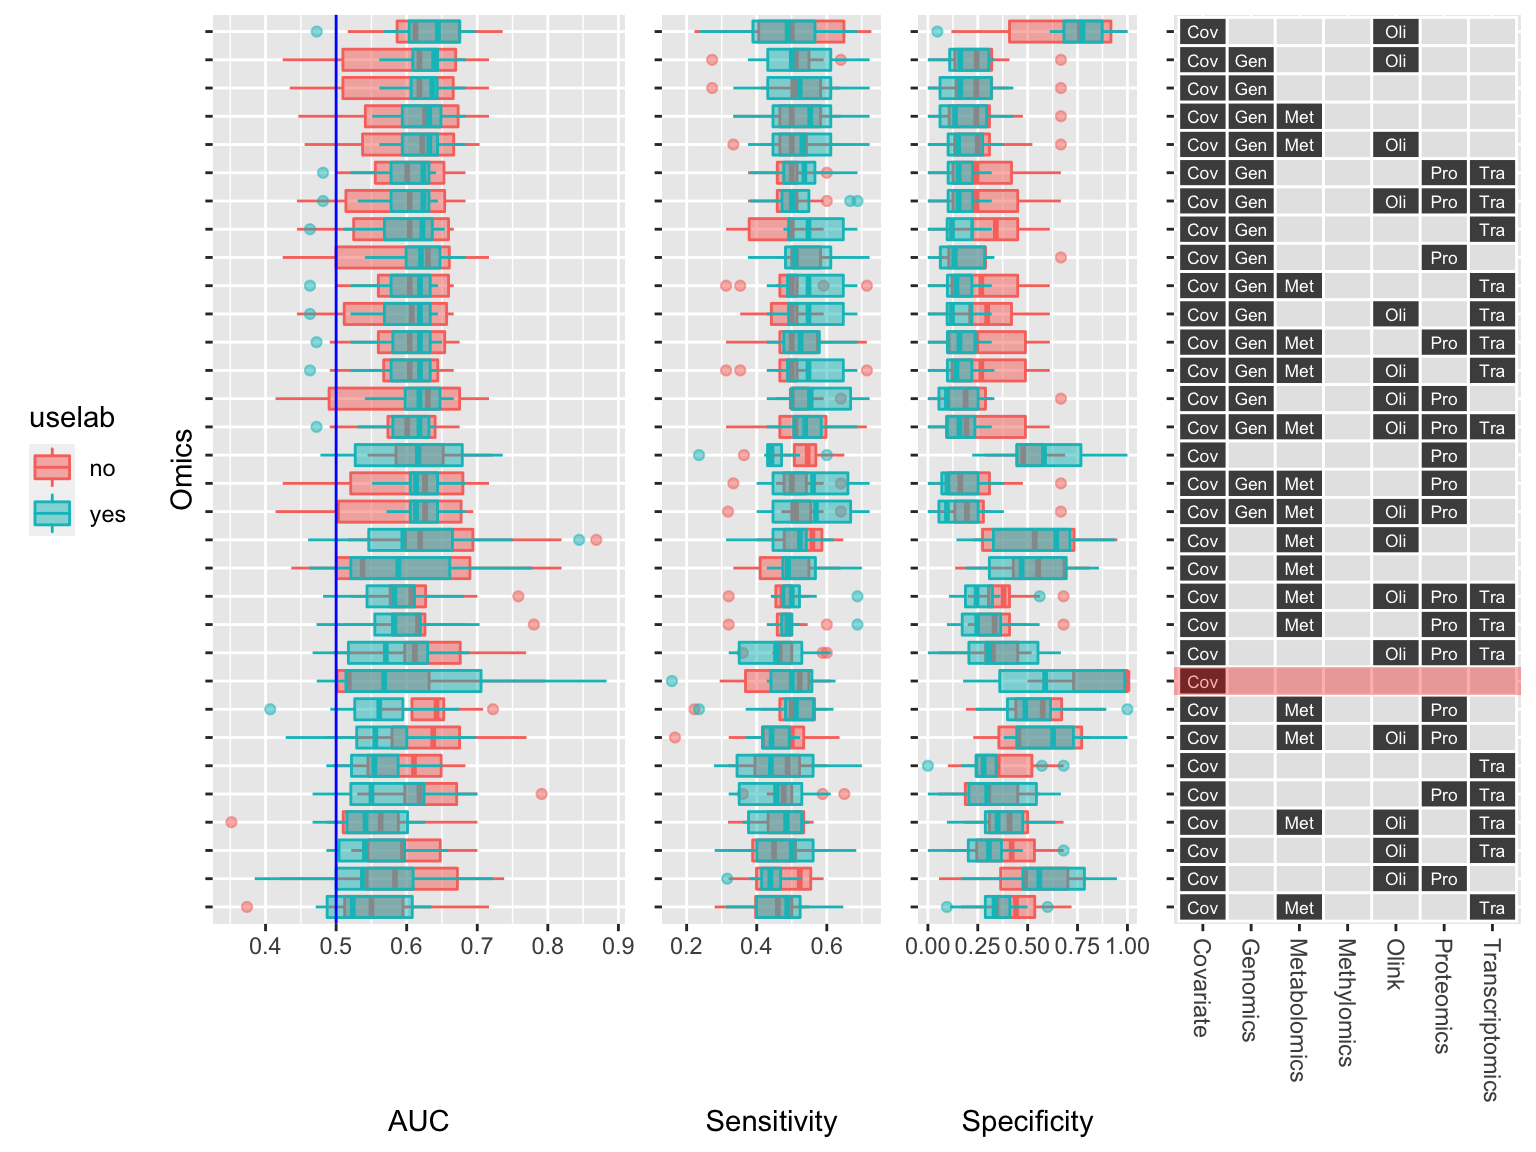
In this case I have a multiomic dataset, each omics has its own properties including number of features, number of samples and predictive performance for a phenotype. I was evaluating the performance of combinations of these omics and wanted to visualize the result. First I will give a descriptive vizualization of the dataset using UpSet plot and then prediction performance of the possible combinations using boxplot and tileplot.
-
Describing distribution of samples of two or more categories and their quantitative properties
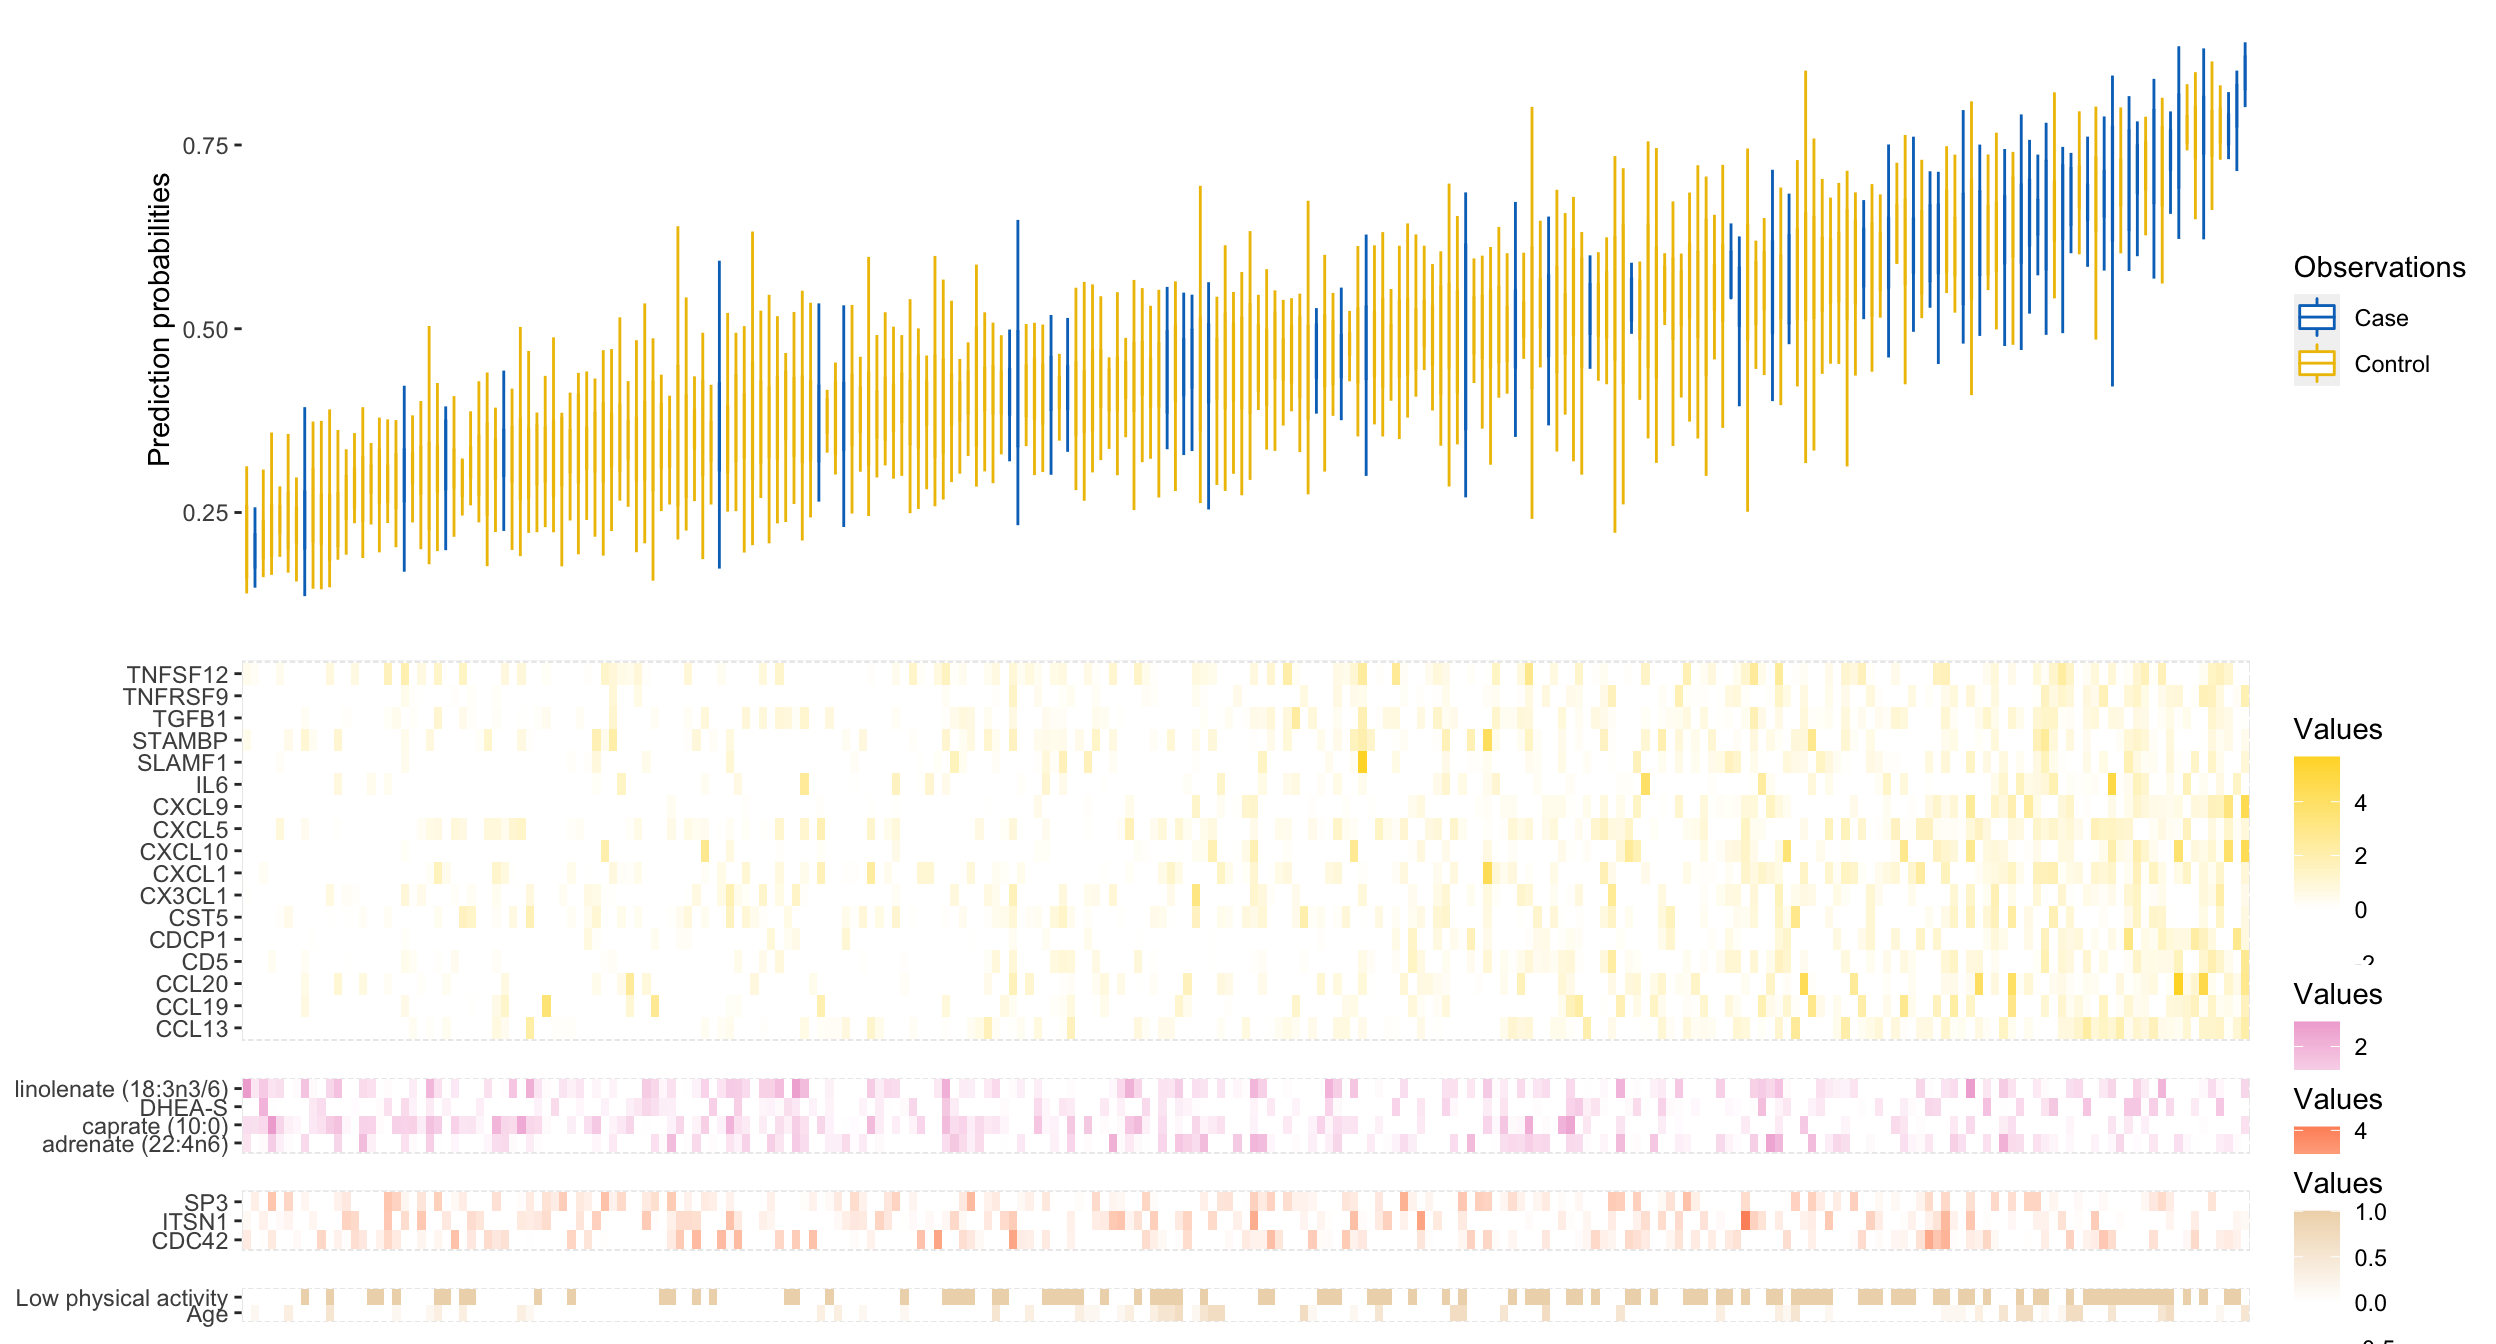
Here I’m not sure the exact name of this kind of plot, Google didn’t really help, so I call it waterfall plot for now, due to the resemblance. This plot is useful when you want to visualize the ranking of the samples of many categories and their quantitative properties at the same time. Particularly, I used this plot to visualize the samples ranked according to their prediction probabilities (in a classification task) and their actual prediction probabilities accross cross-valiation iterations.