
Type 2 diabetes (T2D) is a chronic metabolic disorder characterized by elevated blood glucose levels and is linked to severe microvascular and macrovascular complications such as cardiovascular diseases, neuropathy, nephropathy, and retinopathy, which significantly contribute to global morbidity and mortality. With T2D prevalence rising worldwide, effective management and early prognosis of its complications are essential for reducing healthcare costs and improving patient outcomes. This project aims to assist T2D leveraging availablity of large medical datasets and advancements in AI-driven large language models.
Longitudinal medical records, which encompass extensive data on patient demographics, medical history, test results, medications, and lifestyle factors, play a crucial role in advancing precision medicine for T2D. These datasets enable the identification of patterns critical for personalized prognosis but are complex and voluminous, posing significant analytical challenges. Advances in machine learning, particularly deep learning, have revolutionized the modeling of such complex datasets. Deep learning architectures like CNNs, RNNs, transformers and foundational large language models (LLM) have been employed to predict hospital readmissions and disease progression, significantly enhancing clinical predictions by capturing temporal dependencies in electronic health records. However, challenges remain, especially regarding data sparsity, high dimensionality, missing values, and interpretability.
This study explored the application of foundation models in T2D prognosis by adapting sparse, structured data for input into a pretrained LLM, incorporating a learnable embedding layer for minimal preprocessing. The approach also supports model interpretability, offering valuable insights for personalized healthcare decision-making and highlighting the model’s capability to handle the complexities inherent in longitudinal medical data.
The dataset
This study analyzed data from the German Diabetes Prospective Follow-up Registry (DPV) Initiative, which includes 649,331 electronic health records from over 400 facilities across four European countries. The focus was on 449,185 T2D patients, of which I selected 50,183 individuals with at least 10 clinical visits for sufficient historical data. In this study I used HbA1c and LDL as target variables to demonstrate the model performance. After preprocessing, the final datasets included 36,733 samples for HbA1c prediction and 15,139 for LDL prediction, both showing roughly normal distributions (Figure 1).
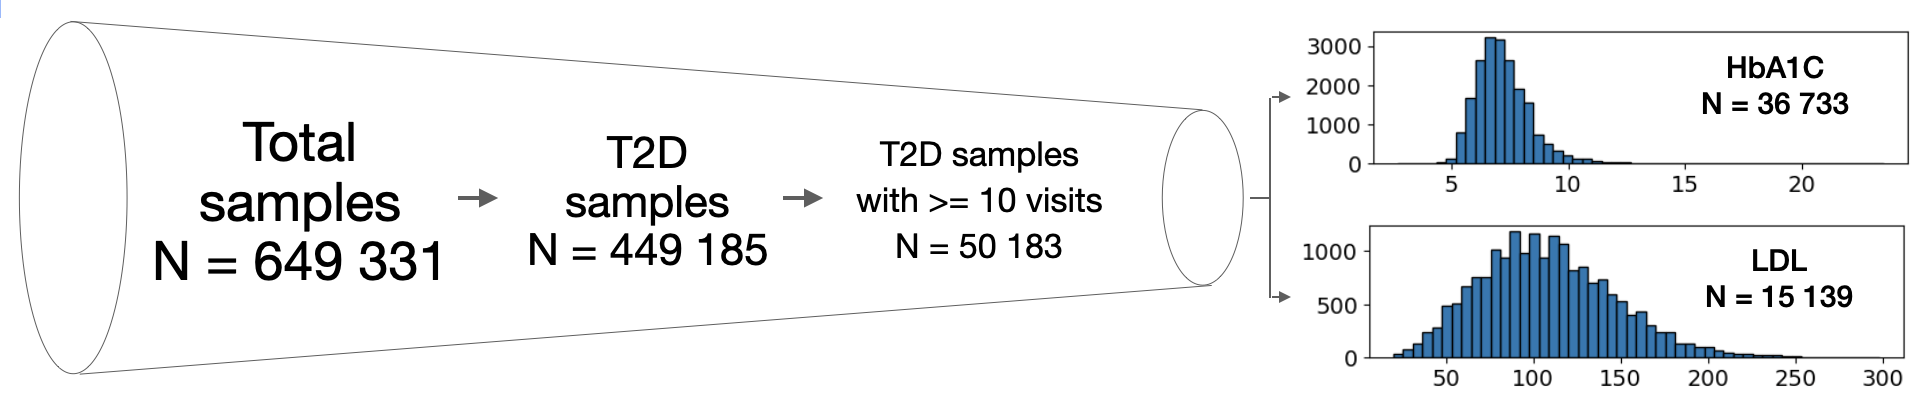
Figure 1. Overview of the dataseet.
Patient timelines spanned 10 to 50 visits, with up to 321 features per visit (e.g., diagnoses, demographics, and treatments) included in the feature window, though not all were consistently recorded. The prediction window defined the forecasting horizon, with mean record lengths of 2,651 days for HbA1c and 2,661 days for LDL samples (Figure 2).
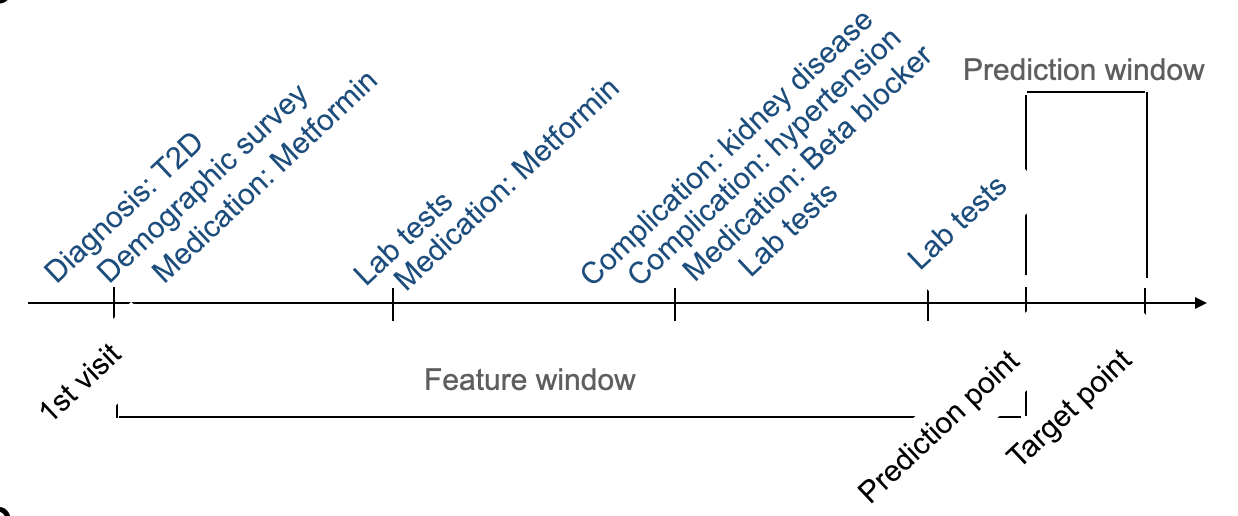
Figure 2. Example of a patient's timeline and definitions of feature window and prediction window.
The LLM adaptation approach
This method was derrived to process sparse medical time series data and adapt it for use with pretrained large language models (LLMs), leveraging their advanced predictive capabilities in the medical field. It addresses the critical challenges of missing data, high dimensionality and domain incompatibility, by transforming medical datasets into a format suitable for analysis by LLMs (Figure 3).
The process begins with preprocessing, where a missing mask is generated to identify gaps in the data, which is appended to the original data matrix, and missing values are imputed with the mean of corresponding variables across time points. This step ensures that the missing patterns will be learned together with the observed data, and the dataset remains complete and consistent, preparing it for further analysis.
After preprocessing, the data is passed through an embedding layer designed to reshape its dimensionality while preserving essential features. This step is crucial for ensuring that the data is compatible with the pretrained LLM, which operates on structured input to generate predictions. These models, trained on vast textual datasets, would be adapted to interpret structured medical data and predict health outcomes based on the longitudinal records provided. This approach exhibits minimal data processing and requires no prompt engineering to finetune the pretrained LLM.
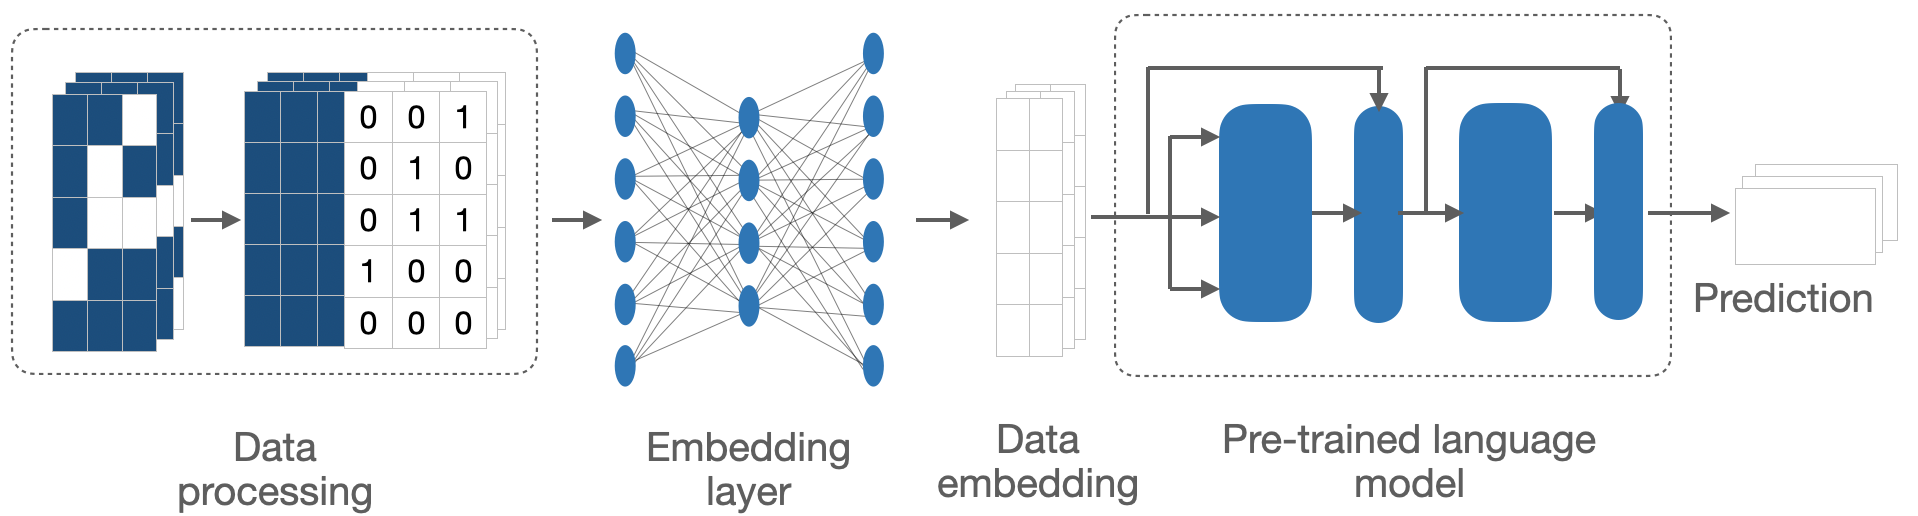
Figure 3. The pipeline for adapting sparse medical time series to pretrained large language models.
Our approach excels in long term forecasting
As an initial analysis suggested that XGBoost alone could already make good prediction for the next doctor visit using only data in the last time point, we would like to test whether our approach utilizing LLM achieve better performance in case of long term prediction using historical data. To this end, we set up a benchmarking scheme where the feature windows included 45 doctor visits and were slided backward to create increasingly large prediction windows, simulting the situations when doctors want to make forecasting far in the future. Specifically, the prediction windows here ranged from a mean of 124.5 days (95% CI: [121.0, 126.8]) to 554.3 days (95% CI: [547.0, 561.5]). Using 10-fold cross-validation, we evaluated the performance of our LLM-based method with the XGBoost model. Result suggested the superior performance of our method, especially for long term prediction. The longer the prediction window, the more significant difference in performance of the LLM method compared to XGBoost (Figure 4).
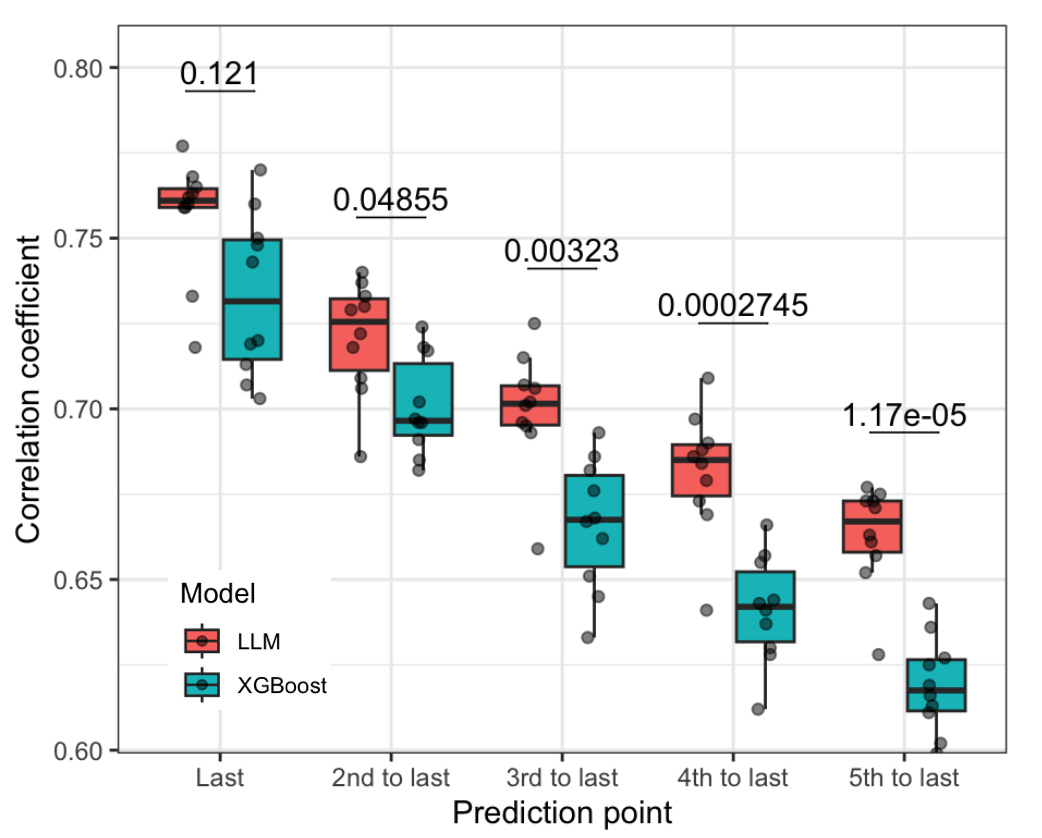
Figure 4. Performance of the LLM-based method compared to XGBoost in long term forecasting.The x-axis represents different prediction windows from shorter (left) to longer (right).
LLM-based approach outperformed baseline at several training sizes
To evaluate the performance of the LLM-based model with varying sample sizes, HbA1c and LDL levels were predicted for the next doctor visit. Its performance was compared to an LSTM model trained from scratch and a random forest model using the last observed target value (LastObs). Both the LLM and LSTM models excluded target-related variables during training to focus on identifying key biomarkers. To this end we leveraged subsets of 20,000 samples with different train-test ratios.
The LLM-based model consistently outperformed both the LSTM and LastObs models in predicting HbA1c and LDL levels, as measured by Pearson’s correlation coefficient. Across training sizes from 5,000 to 18,000 samples, the LLM-based model showed superior performance, demonstrating its ability to capture complex data patterns. For HbA1c prediction, its correlation coefficient improved from 0.618 (95% CI [0.601, 0.653]) at 5,000 samples to 0.749 (95% CI [0.738, 0.759]) at 18,000, while the LastObs model showed minimal improvement, ranging from 0.593 to 0.619. The LSTM model, limited in its ability to handle time-series data, had much lower coefficients, ranging from 0.451 to 0.495 (Figure 5). The LLM-based model’s performance scaled significantly with increasing sample sizes, showing steeper improvements compared to the other methods, particularly at smaller training sizes. At 18,000 samples, it achieved strong correlations with true HbA1c values, highlighting its accuracy, scalability, and ability to effectively leverage large datasets. Similar patterns were observed in case of LDL prediction, please refer to the manuscript for details.

Figure 5. Performance of LLM-based method compared to baselines at different training sizes.
Integrated gradients revealed important signatures of T2D
To assess the clinical relevance of the LLM-based model in predicting T2D progression, we conducted an interpretability analysis using integrated gradients to identify the most influential features for HbA1c and LDL predictions. Analyzing 500 samples across 50 doctor visits, the study highlighted key biomarkers and patient characteristics driving the model’s predictions, providing insights into T2D prognosis and guiding personalized care.
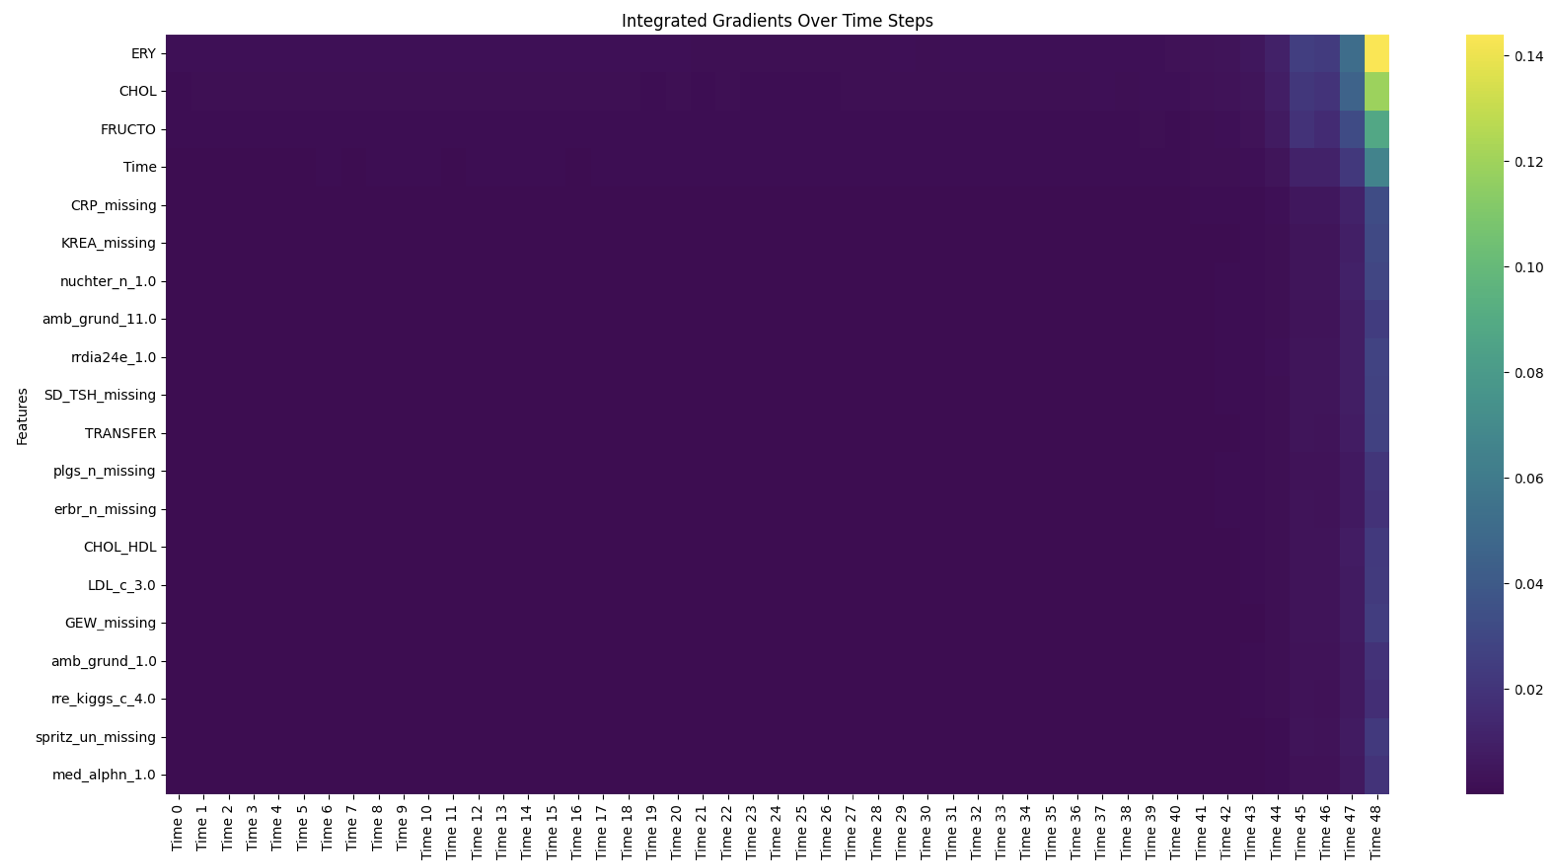
Figure 6. Heatmap of top 20 important features across timepoints, colours represent average gradient across samples.
For HbA1c prediction, the analysis revealed that information from the last five visits was critical, emphasizing the importance of recent medical history (Figure 6). Among specific features, erythrocyte levels, cholesterol levels, fructose levels, and the length of the prediction window were identified as the most influential factors. Erythrocyte, cholesterol, and fructose levels positively correlated with HbA1c predictions, with their impact being most significant during the final visits in the feature window (Figure 7). Erythrocyte count, influenced by blood glucose levels due to glucose binding to hemoglobin A1c, displayed an inverse relationship with HbA1c, though the complexity of this association requires further study. Cholesterol and fructose, well-known markers of insulin resistance, were linked to poor glycemic control, with high LDL cholesterol and excessive fructose intake contributing to elevated HbA1c levels. These findings underscore the potential of these markers as valuable tools for predicting and preventing T2D progression.

Figure 7. Gradient trajectory of erythrocyte count, cholesterol and fructose levels across visits in the feature window, respectively. Each line represents one of 500 samples, colours represent the observed HbA1C level at the target point.
Take home message
- This study serves as a proof of concept for the abaility to adapt pretrained LLMs to medical domain. In short, we leveraged minimal data preprocessing and a learnable embedding layer to finetune the LLM without tedious data transformation and prompt engineering.
- The approach showed strong performance in prognosis of T2D, predicting HbA1c and LDL in both short and long term. More importantly it gave insights into influential visits and clinical properties.
For an indepth discussion of the method and application, please refer to the original manuscript and the github repository. I will also write another post describing the method in details.